This is a report on analyzation of network packets using Wireshark. It involves capturing of packets of three different websites. The packets are then analyzed through four different ways and their results analyzed accordingly and compared. The packets are analyzed by load distribution, graph , time sequence, flow graph and window scaling. The last section contains analyzation a video streaming packet for five minutes then the results are analyzed.
Load distribution uses time period of the loading of every web requested content by the client as a focal point of study. Depending on the network and internet performance the duration which different contents take to load keeps on changing [6].
The load distribution graph here shows the optimum performance of analysis with hundred percent score card.
Through put graphs works by checking the amount of bytes per a given duration of time usually seconds or milliseconds in most cases. To be able to come up with the website performance we calculate the number of packet loss from the graph to be able to deduce the efficiency of the site.By use of time sequence graphs.
Time sequence graph of this website shows instability behavior of bytes with respect to time change. The change however is regular forming even intervals in change of one and half units of bytes
By general flow option the flow graph of this website’s performance is as follows;
Unlike other flow graphs as you will see below, the duration is very minimal just showing average performance or rather highest performance in the whole analysis.
Window scaling deals with TCP window, which uses memory buffers. With data loaded in the buffers the performance of the sites tends to slow down hence the size of the receiver window and the speed are directly proportional
Load distribution focuses on time period of the loading of every web requested content by the client. Depending on the network and internet performance the duration which different contents take to load varies .
From the close look at the load distribution table the packets sent are at a rate of 3 per a period of 0.000253 milliseconds which is quite fast hence fare enough for a relatively good website performance.
Through put graphs operates by measuring the number of bytes per a given period of time usually seconds or milliseconds in most cases. To be able to come up with the websites performance we calculate the number of packet loss from the graph to be able to deduce the efficiency of the site.
From the above graph the performance of the website is very slow averaging to 0.005B/S Bytes per second in this case.
From the name “sequence” the sequence number rises by 1 for each byte of the TCP data sent to and from the server and either way too. Logically a smooth slope is expected for this kind of analysis such that the steeper the line, the higher the throughput data sent to and from.
Flow graphs are concerned with the general flow of packets unless filtered as either TCP,HTTP or any other protocal. This case study is a filtered TCP with TCP flow only show the flow of the packets[5] .
TCP flow are much easier to analyze and be able to come up with idle conclusions of the sites performance. From the graph we can see the time of packet(s)’ transmission, the size of the frame if we are packet switching, the sequence of the frame for the same case. One can also view the ports used in connection.
Talking of window scaling we are simply talking of TCP window receive window which is simply a buffer on both sides of TCP connection holding the incoming data just temporarily. When the data in this cache is not cleaned it consequently causes slow web performance and the opposite is true.
The above snip is the live capture session of the website https://www.onlinenewspapers.com/australi.htm.
By load distribution we explicitly study time duration of the loading page by the browser when the server is requested by the end user on the client side. The aim of this load is to find out a 5 minutes standardized test for the website to determine the performance issues(bottlenecks)[1] .
The snip above displays the whole process of request and response and the average response time period can be calculated and found 00.00.00.000 milliseconds since the page performance here is a little bit higher in terms of speed loading. The overall time taken in the whole process is shown, performance of the website is said to be slow or fast relatively depending on several factors such as the basic computer resources like the RAM and the CPU processing power.
From the graph below I have filtered the HTTP packets since they are typical for study. The data is clear showing counts against the rate and evaluated by percentage to give the overall performance of the website.
By throughput graph, we keenly study the total number of packets sent from back from the server to the client. The study is against the time duration unit second. Throughput graph highlights the number of bytes returned by the server during the load test [3].
The throughput graph here is not very stable and varies giving a fade dotted line on top of the graph. The un-stability may be due unstable file transfer for the cellular data connection.
Using time sequence the y-axis represents the sequence say TCP sequence while the x-axis represents the time. Sequence digits are representatives of bytes sent. Just like the name “sequence” the sequence number rises by 1 for each byte of the TCP data sent to and from the server and either way too. Logically a smooth slope is expected for this kind of analysis such that the steeper the line, the higher the throughput data sent to and from [4].
The above time sequence graph shows a stable throughput for the capture represented by a fade straight line on top of the graph. The sequence for instance in this capture analysis is approximately above 150 bytes per every 0.1 milliseconds. The top line is the client’s computed receive window
As the name suggests window scaling operates on the basis of sizing and resizing the TCP window screen size. Window size could simply be the advertisement of the amount of data in bytes the receiving computer is able to receive at any point.
Choosing the general flow from the statistics flow graph option, the snip below shows the general flow. Flow graphs checks the flow duration of packets from and to the server and the other way round. From
the graph below we have two IPv4 addresses for the server and the client. An average duration is given for both transactions the request and the answer[2].
A snip of the audio capture. By flow graph.Audio capture are fast in performance not taking an average of more than 1 milliseconds as words are coherent .,however during load time the performance is not that good due to buffering which comes as a result of poor network connection
Conclusion.
In analyzation of different website by load distribution, flow graph and window scaling .We find that total different types of results are obtained. This because different types of websites have different rates of packets flowing within it. This is observed through different types of graphs that are drawn in by the application
References
[1] Asrodia, P. and Patel, H.. Network traffic analysis using packet sniffer. International journal of engineering research and applications, 2012, 2(3), pp.854-856.
[2] Banerjee, U., Vashishtha, A. and Saxena, M. Evaluation of the Capabilities of WireShark as a tool for Intrusion Detection. International Journal of computer applications, ., 2010 6(7).
[3] Chappell, L. and Combs, G. Wireshark network analysis: the official Wireshark certified network analyst study guide. Protocol Analysis Institute, Chappell University., 2010.
[4] Ivory, C.J., Networks Associates Technology Inc, Top-down network analysis system and method with adaptive filtering capabilities. U.S. Patent , 2010 ,,757,727.
[5] Orebaugh, A., Ramirez, G. and Beale, J. Wireshark & Ethereal network protocol analyzer toolkit. Elsevier., 2009.
[6] Qadeer, M.A., Iqbal, A., Zahid, M. and Siddiqui, M.R., February. Network traffic analysis and intrusion detection using packet sniffer. In Communication Software and Networks, 2010. ICCSN’10. Second International Conference on, 2010 (pp. 313-317). IEEE.
[7] Wang, S., Xu, D. and Yan, S, April. Analysis and application of Wireshark in TCP/IP protocol teaching. In E-Health Networking, Digital Ecosystems and Technologies (EDT), 2010 International Conference on ., 2010 (Vol. 2, pp. 269-272). IEEE.
[8] Wondracek, G., Comparetti, P.M., Kruegel, C., Kirda, E. and Anna, S.S.S, February. Automatic Network Protocol Analysis. In NDSS., 2008 (Vol. 8, pp. 1-14).
Essay Writing Service Features
Our Experience
No matter how complex your assignment is, we can find the right professional for your specific task. Contact Essay is an essay writing company that hires only the smartest minds to help you with your projects. Our expertise allows us to provide students with high-quality academic writing, editing & proofreading services.
Free Features
Free revision policy
$10Free bibliography & reference
$8Free title page
$8Free formatting
$8How Our Essay Writing Service Works

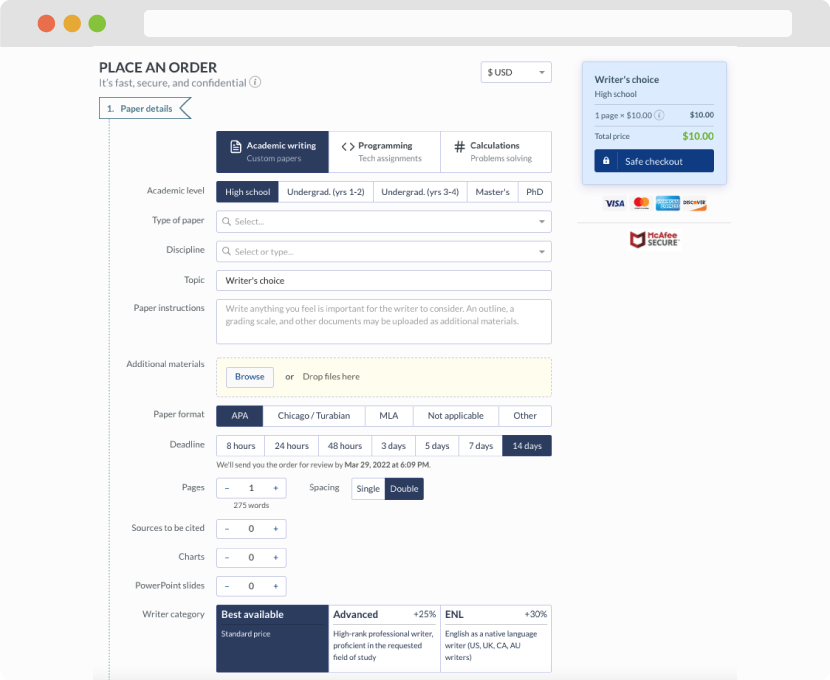
First, you will need to complete an order form. It's not difficult but, in case there is anything you find not to be clear, you may always call us so that we can guide you through it. On the order form, you will need to include some basic information concerning your order: subject, topic, number of pages, etc. We also encourage our clients to upload any relevant information or sources that will help.
Complete the order form
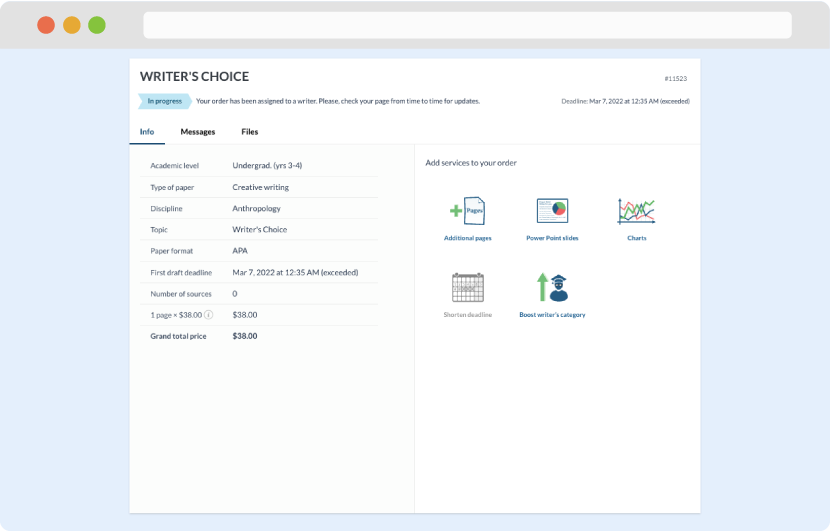
Once we have all the information and instructions that we need, we select the most suitable writer for your assignment. While everything seems to be clear, the writer, who has complete knowledge of the subject, may need clarification from you. It is at that point that you would receive a call or email from us.
Writer’s assignment
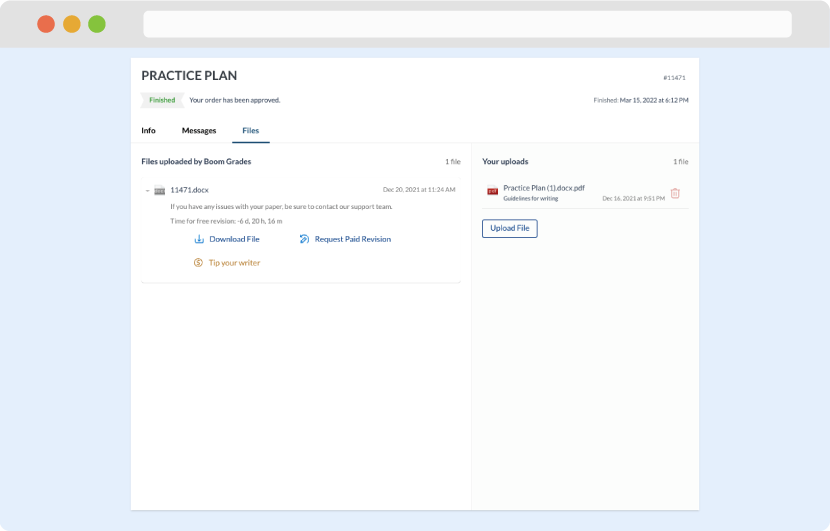
As soon as the writer has finished, it will be delivered both to the website and to your email address so that you will not miss it. If your deadline is close at hand, we will place a call to you to make sure that you receive the paper on time.
Completing the order and download